Tutorial Part 3: Data-Driven Diagrams
Bluefish is a library in SolidJS, a UI framework. That means we can take advantage of SolidJS's features to make our diagrams, too. In this tutorial, we'll see how to make custom marks and relations, how to map over data using Solid's For component, and how to make an interactive diagram with Bluefish.
import "./styles.css";

document.getElementById("app").innerHTML = `
<h1>Hello world</h1>
`;
Making a custom mark
Let's start with our code from the previous tutorial:
import "./styles.css";

document.getElementById("app").innerHTML = `
<h1>Hello world</h1>
`;
Right now if we wanted to change the black borders around the planets, we'd have to edit each one individually. To make this change easier to make, we can make a custom Planet mark.
import "./styles.css";

document.getElementById("app").innerHTML = `
<h1>Hello world</h1>
`;
INFO
Don't forget to import withBluefish from @bluefish-js/solid.
Let's break down the code for the Planet mark:
const Planet = withBluefish((props) => {
  return <Circle r={props.radius} fill={props.color} stroke-width={3} stroke="black" />;
});2
3
Remember, a mark is a function that maps some data (props) to some visual elements. Whenever we make a custom mark in Bluefish, we need to wrap it with withBluefish. The body of the Planet mark function uses the Circle tag, but instead of using literal values for the radius and color, it uses the props object. This allows us to make the mark reusable and flexible.
We call our custom mark like this:
<Planet name="mercury" radius={15} color="#EBE3CF" />INFO
withBluefish handles element naming for us, so we don't have to worry about it when defining our mark.
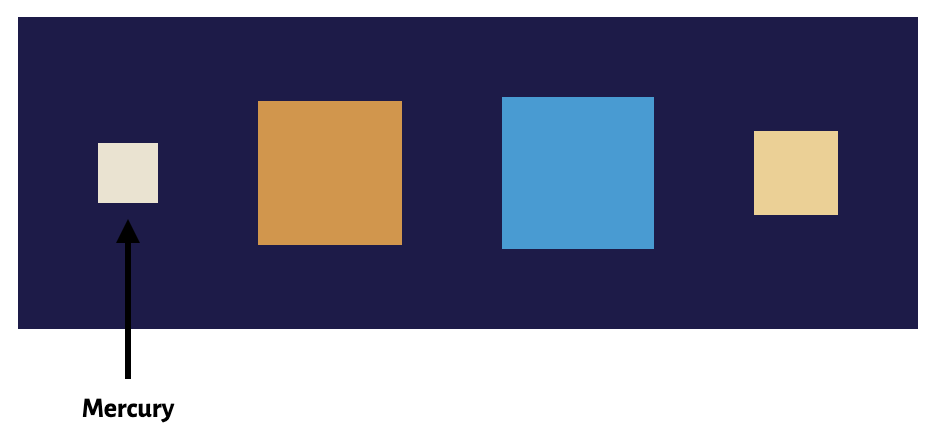
Now that we've made a custom mark, we can more easily replace the Circle with a Rect. Let's replace the body of the Planet mark with a Rect:
const Planet = withBluefish((props) => {
  return <Rect width={props.radius * 2} height={props.radius * 2} fill={props.color} />;
});2
3
For good measure, we'll change the background color to #1E1B4B.
Making a custom relation
Our diagram now looks like this:

Now we'll remove the arrow and refactor the label into a custom relation:
import "./styles.css";

document.getElementById("app").innerHTML = `
<h1>Hello world</h1>
`;
Let's look at the PlanetLabel relation:
const PlanetLabel = withBluefish((props) => {
  const label = createName("label");

  return (
    <Group>
      <Distribute direction="vertical" spacing={20}>
        <Ref select="planets" />
        <Text name={label}>{props.planetName}</Text>
      </Distribute>
      <Align alignment="centerX">
        <Ref select={props.planetName} />
        <Ref select={label} />
      </Align>
      {/* <Arrow>
        <Ref select={label} />
        <Ref select={props.planetName} />
      </Arrow> */}
    </Group>
  );
});2
3
4
5
6
7
8
9
10
11
12
13
14
15
16
17
18
19
20
:::
There are a couple things to notice. First, instead of using a raw string for the label name, we're creating a name using createName. This scopes the name to the PlanetLabel, so we don't have to worry about naming conflicts with other elements. If we had two instances of PlanetLabel and used a raw string, we'd have to worry about naming conflicts.
Next, notice we're using a Group component. This component groups relations together into a compound relation.
Mapping over data with Solid's For component
Time to make our diagram data-driven! We can drive this diagram with an array of planet data.
const planets = [
  { name: "Mercury", radius: 15, color: "#EBE3CF" },
  { name: "Venus", radius: 36, color: "#DC933C" },
  { name: "Earth", radius: 38, color: "#179DD7" },
  { name: "Mars", radius: 21, color: "#F1CF8E" },
];2
3
4
5
6
import "./styles.css";

document.getElementById("app").innerHTML = `
<h1>Hello world</h1>
`;
To use this data, we use Solid's For component. This component maps over an array of data and renders a component for each item in the array. We use For twice, once for the planet marks and once for the planet label relations.
<For each={planets}>{(planet) => <Planet name={planet.name} radius={planet.radius} color={planet.color} />}</For><For each={planets}>{(planet) => <PlanetLabel planetName={planet.name} />}</For>For takes an array as input to its each props and takes a function from a datum to a component as its child. It works a lot like Array.map.
INFO
If you're familiar with React, you may wonder why we're using For instead of Array.map. SolidJS uses For, because it updates more efficiently when the data changes. The For component diffs the input array, looking for changes, and only re-renders items that have changed. (Think D3 selections!)
Adding reactivity with signals
Finally, let's add some interactivity to our diagram. We'll use Solid's createSignal to make a slider that changes the spacing between planets.
import "./styles.css";

document.getElementById("app").innerHTML = `
<h1>Hello world</h1>
`;
First we create a signal with createSignal.
const [spacing, setSpacing] = createSignal(50);We give it an initial value of 50, and it returns a getter and a setter.
Next we make a slider to control the signal:
<input type="range" min={0} max={100} value={spacing()} onInput={(e) => setSpacing(Number(e.target.value))} />The getter is a function so we have to call it to get the current value of the signal.
The setter is a function that takes a new value and updates the signal.
We use the onInput event listener to update the signal when the slider is moved.
Finally, we use the signal in the StackH component to set the spacing between planets:
<StackH spacing={spacing()}>Again, we have to call the signal getter to get the current value of the signal.
Wrapping up
Tada! We've now seen how to use SolidJS to make an interactive diagram with reusable marks and relations. We've made custom marks and relations, mapped over data with For, and added interactivity with signals.
